.NET Cold Startup Performance: An Example
By Eric — — 6 minute readWhen running a .NET application for the first time after rebooting or hibernating the computer, you might find that it takes a long time to start up. I've been trying to address this problem in a few situations recently. In spite of having read several articles on the subject, I wasn't having much success. Following some of the advice gave no noticeable improvement, and some (like using NGEN) actually slowed down startup. But I had some success recently, so I thought I'd explain how.
First of all, it's important to understand that the CLR itself loads up pretty fast. If you create "Hello, world", even using Windows Forms, it starts almost instantly. As things get more complicated, though, you start loading more and more assemblies and classes, and the time to read all of those from disk (possibly combined with other I/O your application might do) is what makes cold startup so slow. If the application starts really fast on the next run, that's because all of those assemblies and classes are cached, and physical disk reads aren't necessary.
I'm working on an add-in that runs in Word, Excel and PowerPoint. One of the objectives was to minimize the startup impact on the host application, so I started measuring it using an early implementation of the add-in. The results were not promising. On a low end machine, cold startup with the add-in took 18 seconds, compared to 8 seconds for the application without the add-in.
Performance Monitor has some useful counters for measuring your optimization. In my case, I added the .NET CLR Loading object's "Total Assemblies" and "Total Classes Loaded" counters for WINWORD:
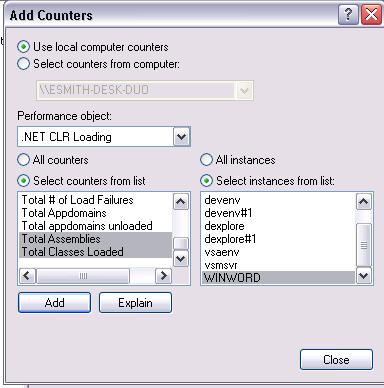
"Report" view is best for these. It just shows the plain numeric values of the counters. I discovered that I had 19 assemblies and 517 classes being loaded at startup. My strategy was to reduce those two numbers and hope that I'd see a corresponding improvement in startup time.
Next I used Visual Studio to debug the add-in, paying attention to the Modules window. This isn't totally reliable in terms of figuring out what code loaded what modules since the debugger does things like call properties on objects while it is running, but it is still kind of useful. One thing jumped out at me right away. Even though I was running my add-in in Word, the interop assemblies for Excel and PowerPoint were also loaded. Looking at the code, I saw this:
Word.Application wordApp = hostApplicationObject as Word.Application;
if (wordApp != null)
{
  application = new WordApplication(wordApp);
  return;
}

Excel.Application excelApp = hostApplicationObject as Excel.Application;
if (excelApp != null)
{
  application = new ExcelApplication(excelApp);
  return;
}

PowerPoint.Application powerPointApp = hostApplicationObject as PowerPoint.Application;
if (powerPointApp != null)
{
  application = new PowerPointApplication(powerPointApp);
  return;
}
throw new NotSupportedException("Unsupported application");
Here the add-in is figuring out which application is running and initializing itself accordingly. The problem is that when the JIT compiler compiles the method with this code, it needs to load Word.Application, Excel.Application and PowerPoint.Application from the three interop assemblies.
I changed the code in two ways to fix this. First, instead of detecting the application by casting to the various Application objects, I used the name of the process. Second, I split the code that references each Application object into separate methods:
string processName = Process.GetCurrentProcess().ProcessName;

switch (processName)
{
  case "WINWORD":
    GetWordObjects(ref application, ref uiManager);
    break;

  case "EXCEL":
    GetExcelObjects(ref application, ref uiManager);
    break;

case "POWERPNT":
    GetPowerPointObjects(ref application, ref uiManager);
    break;

default:
    throw new NotSupportedException("Unsupported application: " + processName);
}
Another thing I discovered in the debugger is that the logger we're using, NLog, has some pretty heavy initialization. Typical usage of NLog is to have a static member of a class like this:
private static Logger logger = LogManager.GetCurrentClassLogger();
The problem here is that the logger starts up at type initialization time, dragging in System.Configuration, System.Xml, System.Web (!?), System.KitchenSink, etc.
Instead of doing this, I created a property that would get the logger on demand, and then made sure that I didn't log anything on startup unless I had to log an error. It wasn't enough to just say, "Oh, this is just at DEBUG log level, so that's OK." If there was any logging, regardless of level, it would require that the logger be initialized even to figure out that it didn't need to actually log anything.
I made a couple of other optimizations. First was to defer calling Application.EnableVisualStyles until after startup (a luxury for my situation since I didn't have to show UI right away) which saved me from having to bring in System.Windows.Forms. Another was to avoid using Debug.Assert. In this case, at NextPage we have a "Verify" utility class in a common library that has similar functionality. Since I was already loading Common.dll, I used that instead.
After these changes, my performance counters showed 13 assemblies and 175 classes loaded. Word was now starting in just 11 seconds instead of 18 with the unoptimized add-in. There's still potential for some more improvement, but that is good enough to let me continue with implementation without the fear that startup time would be unacceptable.