Remote Debugging
By Eric — — 3 minute read"It works on my machine" is not a very solid defense. And when something baffling is happening in your code on a non-development machine, and logging doesn't give enough clues, it can be a good time to take advantage of remote debugging.
In the past I've equated remote debugging to a configuration challenge akin to establishing a connection between a Macintosh laptop and an alien mainframe, but hey, even that works sometimes. In truth, remote debugging with Debugging Tools for Windows could be a little harder than that; I'm not sure. I do know that remote debugging with Visual Studio 2005 is pretty easy.
The basic steps are these:
- On the remote machine, run msvsmon.exe. It will show a small window with a message saying something like "Msvsmon started a new server named 'ADOMAIN\Joe.User@AMACHINE'."
- On the debugger machine, use Visual Studio's Debug > Attach to Process command to connect to the machine (using the server name from msvsmon in the 'Qualifier' field) and to the remote process you want to debug.
To make things easier on myself, I created a network share on my development machine and added a few items to the share. These let me walk over to a QA box and get going quickly:
- A shortcut to msvsmon.exe (which links to "C:\Program Files\Microsoft Visual Studio 8\Common7\IDE\Remote Debugger\x86\msvsmon.exe") so that I don't have to install or copy any files to the remote machine.
- A remote desktop connection to my development machine (with the password unspecified, of course) so I can remote control the debugger.
- A text file with some reminders of extra steps that might be needed to get things working.
Access and Permissions
For example, there's a pretty good chance that you'll need to give yourself debugging privileges on the remote machine. Msvsmon makes that easy -- use the Tools > Permissions command and add your user name. The permission will automatically revert when you exit msvsmon.
Firewalls can be another challenge. Msvsmon can help with that too in some cases, offering to open up the required ports. Sometimes you might have to disable the firewall manually, though.
Things also get tricky if your development machine and the QA machine are on different domains. If there isn't a trust between the domains, you might look at a blog posting by greggm. Even if there is trust between the domains, you might need to further qualify the server name that msvsmon reports. For example, I needed to fully-qualify the machine name:
As reported in msvsmon: THEDOMAIN-NET\cube55b@LAB01
What actually worked: THEDOMAIN-NET\cube55b@LAB01.thedomain.net
[Update June 25, 2008]
One other thing I noticed (but can't explain) is that I've had trouble connecting to the debug monitor when the machine it is running on is connected to the network by a wireless connection. After making many unsuccessful connection attempts over wireless the other day, I finally plugged in a cable and was able to connect immediately.
Symbols
Trying to debug without symbols is not much fun, and it is extremely rare that the build running on a QA machine will exactly match what's on your development machine (unless your development machine is also the build server). Because of that, I always build binaries with an accompanying debug symbol file (PDB), even in Release mode. I also set up a share on our build server to act as a symbol server. Debugging Tools for Windows includes symstore.exe, which I use to copy PDB files to the share so that they are accessible to anyone who needs them.
To reference the symbols from Visual Studio, go to the Debugging Options and add a reference. In this case, the build server's symbol share is at \\nplab078\Symbols:
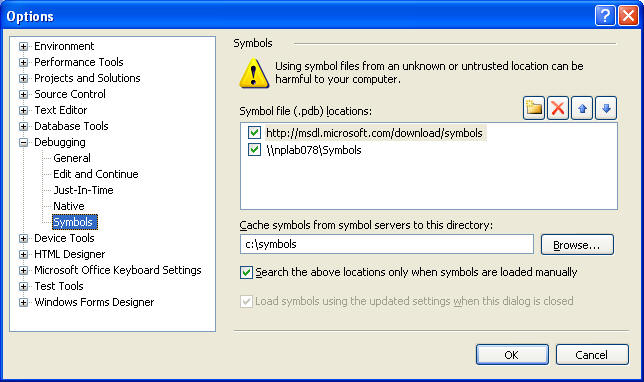
The other symbol file location above is Microsoft's public symbol server. By adding that, you can also get call stacks into system calls while debugging. It's not quite like having source code, but it does sometimes provide some extra insight to help track down a problem.