Finding Unmanaged Memory Leaks
By Eric — — 5 minute readAt work we had a long-running .NET process whose memory usage seemed to be going up, but not coming down. In investigating, I learned a few things about leak hunting, and ultimately tracked down perhaps the most insidious leak I've ever seen.
My first approach was to try to profile the process' memory usage with the Visual Studio 2005 profiler, but after wading through the report for a while, I was stymied by a minor obstacle: I didn't know what the heck I was doing. I didn't have a good sense of what the memory in a .NET process ought to look like, or what was unusual. I found some useful information in an article by Tim Anderson, but I still was lost.
I thought maybe a dedicated profiler might steer me along better, so I downloaded a trial of Red Gate's ANTS profiler. After spending some time with it, I found a few little memory issues (did you know that the default Windows Forms icon is something like 10K compared to a blank icon at 1K?), and some potential bigger issues (we have a background thread that holds a large data structure in memory even when the thread is paused). The epiphany came when I realized that I was looking at a process with 100 MB in private bytes, but the entire managed heap was less than 1 MB. The leak wasn't even in the managed heap.
I wondered if there might be some way to use the unmanaged debug heap, and _CrtDumpMemoryLeaks from a C# application. I briefly considered pinvoke, but quickly ran into complications with loading the C runtime libraries, since they have to be in the side-by-side directory and only loaded from an application with a valid manifest, etc. etc.
Wayne Nelson, my boss, reminded me of a module that makes heavy use of unmanaged code that we've suspected of leaking for a while, and we came up with the idea of exercising that code in the presence of performance counters. It was pretty easy to write a little console application that referenced that module, invoking its main call path in a loop of 100,000 iterations.
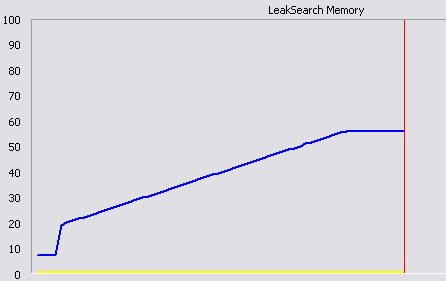
Then I opened Performance Monitor and added a couple of counters: One for the process private bytes, and the other for the total bytes in all managed heaps in the process. I also scaled the private bytes to match the scaling of the managed heaps. Here is the resulting graph, where the blue line is private bytes, and the yellow line is managed bytes:

It's obvious that the leak is, in fact, in unmanaged memory. The first jump is due to loading in some native DLLs, but the steady climb from there to the next plateu represents the 100,000 loop iterations.
Having the graph as a tool, it became a matter of doing a conceptual binary search through the code. I would comment out large chunks until the private bytes line ran flat. Then I knew that the leak was in the commented-out code. In this case it became almost reductio ad absurdum. All that was left was a pinvoke call:
int result = NativeMethods.StgOpenStorageOnILockBytes(lockBytes,
  IntPtr.Zero,
  this.readOnly ? PropertyReadFlags : PropertyWriteFlags,
  IntPtr.Zero,
  0,
  out storage);
The ILockBytes being passed in was my own C# implementation that
wrapped a System.IO.Stream instance, so to get a little closer to
absurdum, I made it a zero byte Stream and still had the leak. In
other words, I was trying to open structured storage on a zero byte
stream, which obviously failed, but still caused a memory leak. The only
things left in play were my pinvoke signature, and my ILockBytes
implementation, which didn't allocate any unmanaged memory.
The call to StgOpenStorageOnILockBytes did call my ILockBytes.Stat
method:
public void Stat(ref System.Runtime.InteropServices.ComTypes.STATSTG pstatstg, int grfStatFlag)
{
  pstatstg.cbSize = stream.Length;
  pstatstg.type = (int)STGTY.LOCKBYTES;
}
It seemed pretty harmless.
A hint came from the ILockBytes::Stat
documentation.
If grfStatFlag is STATFLAG\NONAME, then the Stat implementation
shouldn't allocate the STATSTG::pwcsName member. Checking in the
debugger, grfStatFlag was, in fact, STATFLAG\NONAME. But I wasn't
allocating any memory or setting pwcsName anyway.
Then I realized that the STATSTG structure was coming from unmanaged
code, and as such code is wont, it was completely uninitialized. The
pwcsName member was coming through pointing to garbage. I changed my
Stat implementation to set pwcsName to null, and my Performance
Monitor graph went sublimely flat. My theory is that upon returning from
the Stat method, the marshaler was taking the never initialized garbage
string and allocating a copy with CoTaskMemAlloc. But since the caller
had specified STATFLAG\NONAME, it was not expecting to need to free any
memory. For good measure, I initialized all of the STATSTG members.
While this was a pretty strange leak, the strategy for finding it can be applied to other more mundane leaks as well.
- Write a small program that repeatedly calls any suspect code (anything that calls unmanaged code).
- Set up a Performance Monitor session that graphs both private bytes and the managed heaps to see if you've found the general leaky area.
- Start trimming the code and rerunning the test program until the leak disappears.
- Figure out what could possibly leak in the located code.