.NET Cold Startup Performance: More
By Eric — — 2 minute readA few months ago I wrote about an approach to improving .NET cold startup performance. Here's a little more information that I've learned since then.
Another useful tool for optimizing cold startup is Microsoft's free CLR Profiler 2.0. While this tool has the aesthetics of a wadded-up paper sack, it does have the ability to graph each assembly that gets loaded, and the method that caused it to be loaded. This makes it easier to figure out why a particular assembly got loaded, allowing you to consider whether there might be a way to avoid loading it or postpone loading it until some less critical moment.
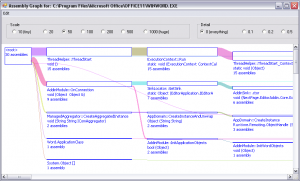
To generate the assembly graph, click the Start Application button in the profiler. It lets you browse to the executable, which it will then launch. When you close the application, the profiler displays a summary screen with a bunch of information about the managed heap and garbage collection. You can close that window. Instead, go to the main menu and pick View > Assembly Graph. You'll see something like this:
Assembly Graph Window (click for larger image)
At the far left edge of the graph, you can see the total number of assemblies (30) that were loaded during the application run. The edges from there represent method calls that caused other assemblies to load. Underneath the method name is the total number assemblies loaded through the full call stack. As you move to the far right side of the graph, you eventually see each individual assembly that is loaded. If you click on a node in the graph it sort of highlights (is plaid technically a highlight color?) the edges in and out of the node. That can be really handy when the graph lines criss-cross over each other.
In my case, where I'm writing a Word add-in, I have some initialization that must happen on the main thread at startup. Other initialization is put on a low priority background thread, which allows Word to start up quickly while continuing to load up the add-in functionality for when it will be used. To get a better picture of startup, I commented out the background thread. Then I looked for call paths that loaded lots of assemblies to figure out if any of those could be deferred to the background thread.
I found that making an XML-RPC call was pretty expensive in terms of code loading. The RPC call itself was pretty fast -- just talking to another process on the same machine, but it took loading classes from five additional assemblies just to make the call, which hurts cold startup performance. At this point we're trying to figure out if the current performance is acceptable or if we need to tweak the add-in's behavior a little to delay the RPC call to the background thread.
